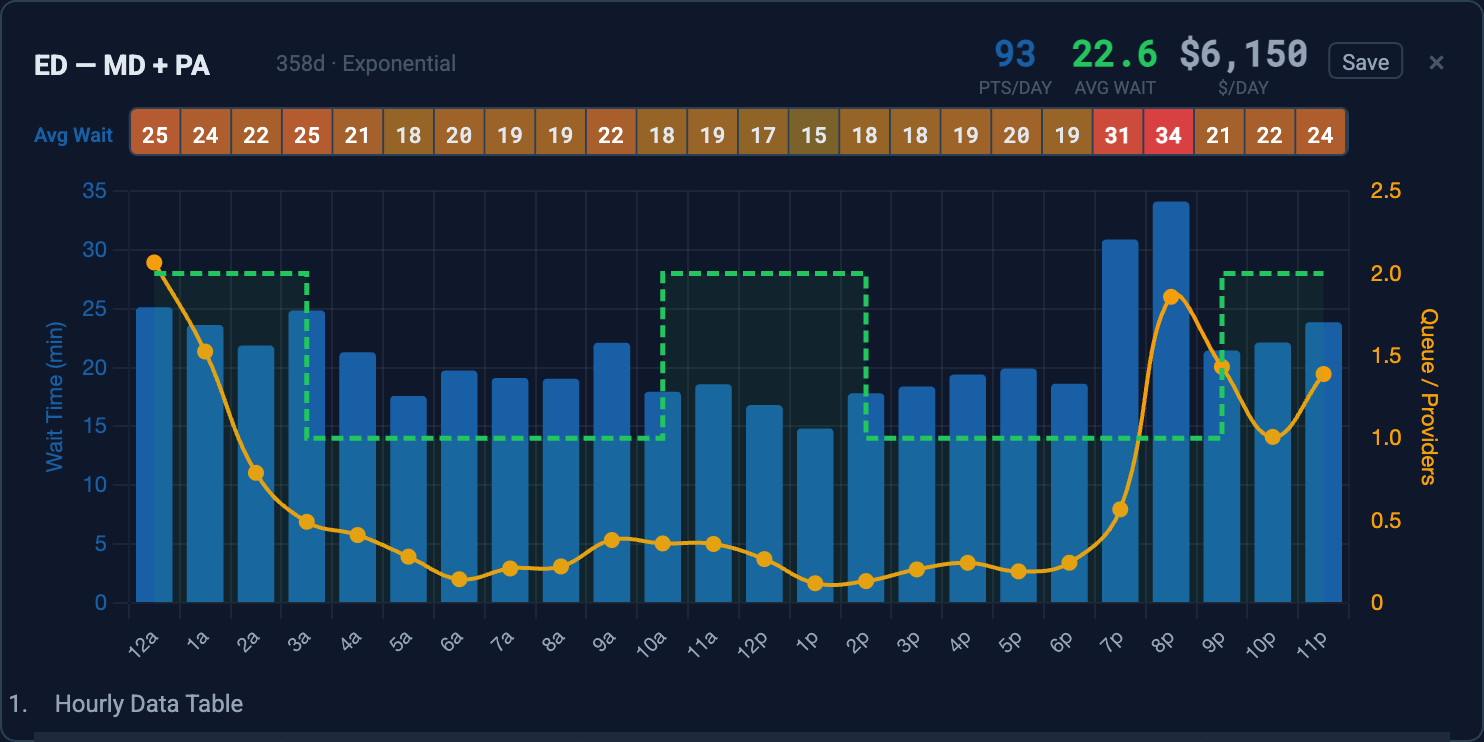
Run your ED's numbers, compare staffing scenarios, see the wait-time and cost tradeoff — before you commit to the schedule.
Runs in your browser — phone, tablet, or desktop. No install. No IT department.
Patients arrive randomly, join a single queue, and are routed to the next available provider. The simulation models this — thousands of times — to predict your wait times.
Discrete event simulation — each dot is a patient modeled individually through the system.
Your facility runs on one MD around the clock. Wait times spike during the day. What if you added a PA from 8am to 5pm? Run both scenarios — same patients, different staffing — and see the answer in seconds.
One change. One click. The simulation runs a full year of patient arrivals and shows you the difference — hour by hour.
Try It FreeRun your current staffing vs. adding one provider from 4-10pm. See the wait time impact by hour — not just the average.
Stress-test your current staffing against higher demand. Find out where the queue breaks before your patients do.
Model MD + PA together. Compare the wait time tradeoff against the cost difference under the same arrival pattern.
"We thought we needed another provider for the evening rush. QSimHealth showed us that shifting one existing provider by two hours eliminated the wait time spike entirely. Same headcount, better coverage."
-- Medical Director, Regional Medical Center
Schedulers fill shifts. QSimHealth shows what happens when patients arrive.
For simple cases, maybe. But real facilities aren't textbook problems.
That's why Claude uses QSimHealth — instead of guessing.
Enter your arrival patterns, staffing schedule, and treatment times. QSimHealth runs a full year of patient flow and shows you exactly where your staffing works — and where it doesn't.
Built for emergency departments (random arrivals), walk-in clinics (random + scheduled), and appointment-based offices. Select your type, enter your data.
Model one provider type or multiple (MD + PA/NP, attending + resident, etc.). Each provider type operates independently — see how each contributes to wait times and capacity.
Treatment times modeled with Exponential, LogNormal, Normal, or Poisson distributions — not just averages. Because averages hide the worst days.
Enter a 24-hour pattern — the simulation runs it over a full year with randomness. Captures the variability that short observations miss. Outputs reflect what actually happens across 365 days, not just one good shift.
Average arrivals, average wait time, and average queue length — by hour. See exactly when your staffing works and when it doesn't.
Pre-configured inputs and outputs. Enter your arrival pattern, staffing schedule, and treatment times. Run. Decide. No simulation expertise needed.
Upload up to a year of arrival timestamps and treatment durations — no patient identity needed. QSimHealth bins arrivals by hour, fits treatment time distributions (Exponential, LogNormal, Normal), and populates the simulation automatically. Your data becomes a calibrated model in seconds.
Claude can run QSimHealth simulations directly. Ask it to compare scenarios, adjust staffing, or explain results — conversationally. QSimHealth is the simulation engine; Claude is the analyst.
Every staffing decision has a price tag. QSimHealth calculates the cost of each scenario alongside wait times — so you can weigh the tradeoff before you commit.
Enter your actual rates. The simulation calculates the rest.
Students and faculty with .edu email. Full simulation access.
Site license for medical schools and PEMBA programs. Citation rights, classroom use, alumni access.
For ED directors and operations leaders at single facilities. Full features, cancel anytime.
Multi-facility deployments, health systems, and white-label licensing. Custom integration available.
🤖 AI + MCP integration available across all tiers — ask Claude to run scenarios in plain language.
Or schedule a call to see it in action.
Developed in conjunction with the University of Tennessee Physician Executive MBA program. Staffing decisions backed by descriptive through-time simulation, not intuition.
QSimHealth models every patient individually — arrival, queue, provider assignment, treatment, departure — across a full year of simulated time: 8,760 simulated hours. Each hourly average is computed from 365 observations, producing statistically stable results you can staff against with confidence.
Built on discrete event simulation and M/M/c queuing theory — the same operations research methodology used in manufacturing, aerospace, and healthcare for over 50 years. Refined across 35 years of production simulation. This isn't a spreadsheet estimate or an AI guess — it's a validated simulation engine, now accessible as a web application.
We'll model your facility's arrival pattern and staffing schedule — and show you what the simulation reveals.
Product updates, case studies, and fresh insights — straight to your inbox. No spam.